This dynamic dashboard provides quick stats for a day, week, or month, giving you useful, at-a-glance insights into your practice's productivity and performance, including payments posted, encounters created, patients seen, and more.
RXNT’s Advanced Reporting feature is exclusively accessible to users with an advanced reporting license! Learn more about Advanced Reporting licenses here!
Viewing the dashboard
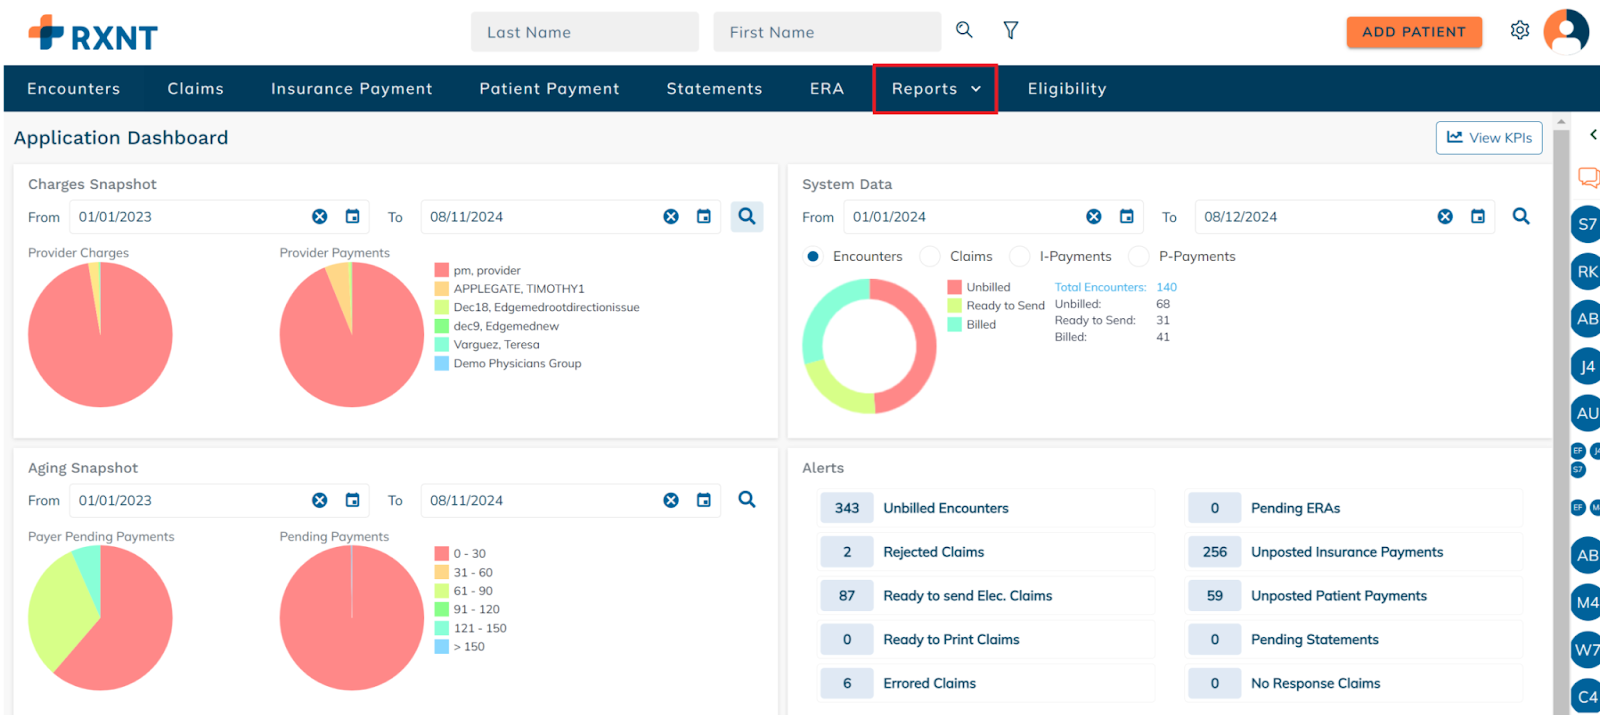
Click Reports.
Select All.
Click Daily Summary Report under the Advanced Reporting section.
Understanding the dashboard
The dashboard is organized into several different graphs that allow you to view data on different parameters such as encounters created, payments posted, patients seen, units billed, and more.
Select date filter
The date will automatically default to Yesterday, but you can also view the dashboard for Today, This Week, or This Month, as well.
Weeks are configured to start on Sundays.
Filter by
The dashboard is automatically filtered by Rendering Providers, but you can also filter it by Location using the dropdown menu. To narrow the results further, select or deselect specific Rendering Providers or Locations by clicking the checkboxes on the left.
Number of patients seen
This section displays the Number of Patients Seen within the selected timeframe, which is determined by patients with a completed appointment within the selected timeframe.
Number of no-show patients
This section displays the Number of No Show Patients within the selected timeframe, which is determined by patients who were flagged as a No Show for appointments in the Scheduler.
Number of canceled appointments
This section displays the Number of Canceled Appointments within the selected timeframe, which is determined by patients with appointments marked as canceled in the Scheduler.
Patients created and deactivated
The Patients Created and Deactivated graph displays the number of patients created and deactivated in the system within the selected timeframe.
Encounters
The Encounters graph displays the number of Created Encounters and Billed Encounters within the selected timeframe.
Charges
The Charges graph shows the total Created Charges and Billed Charges during the selected timeframe.
Units
The Units graph displays the total Created Units and Billed Units during the selected timeframe.
Payments
Total payments
The Total Payments graph displays the total Payment Amount and total Posted Amount within the selected timeframe.
Insurance payments
The Insurance Payments graph displays the total insurance Payment Amount and total Insurance Payment Posted Amount within the selected timeframe.
Patient payments
The Patient Payments graph displays the total Patient Payment Amount and total Patient Payment Posted Amount within the selected timeframe.
Credits/debits
The Total Credit / Debit graph displays the total Credit and Debit amounts within the selected timeframe.
Overview
The graphs below display an overview of Total Payments, Total Posted Payments, Charges Created, and Charges Billed, with the ability to view by Place of Service or Rendering Provider.
Viewing these graphs by Rendering Provider or Place of Service provides an insightful glance into the performance of a Provider or Location.
Details
The charts at the bottom offer a detailed breakdown of Created Charges, Billed Charges, Payments, and Posted Payments. They display information such as patient names, chart numbers, payment IDs, payers, encounter IDs, rendering providers, billing providers, dates of service, procedure codes, payment amounts, payment dates, charge amounts, units, initial billed dates, encounter created dates, and billing event types.
Still need help? Contact us!
Have a great idea? Tell us about it!